
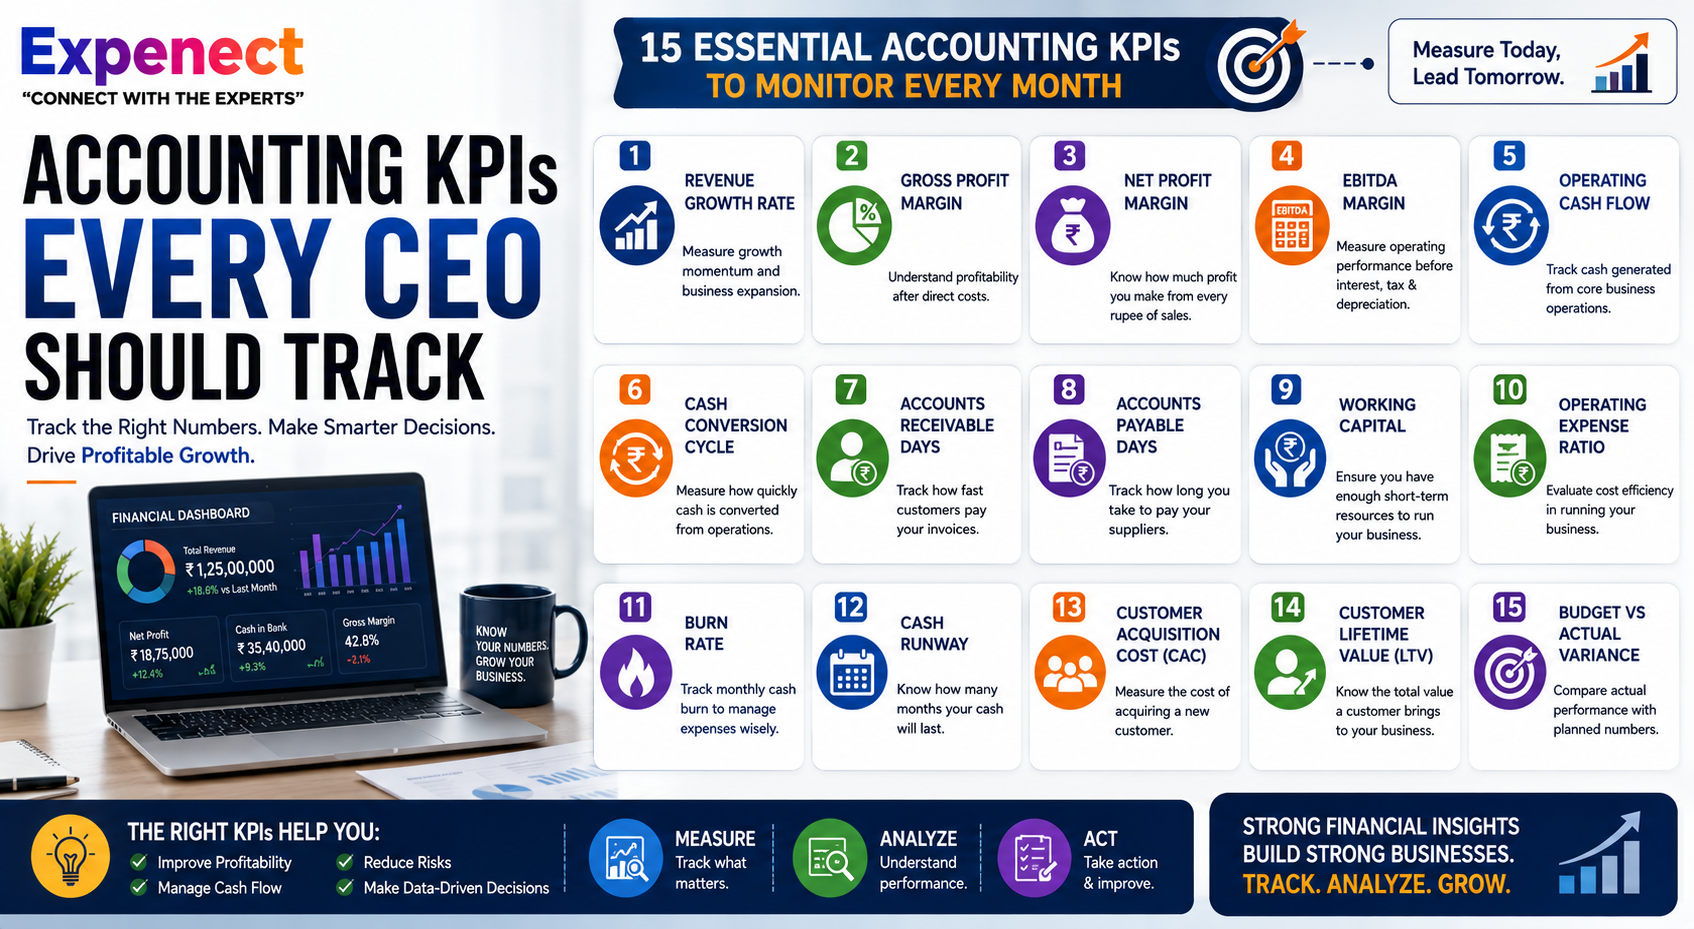
15 Accounting KPIs Every CEO Should Track Monthly
Running a business without monitoring financial KPIs is like driving a car without a dashboard.
You may know where you want to go, but you don’t know your speed, fuel level, engine temperature or whether something is going wrong.
The same applies to business.
Revenue might be increasing, but profitability could be declining. Sales might be strong, but customers could be taking longer to pay. Your company might be profitable on paper while simultaneously running short of cash.
This is why CEOs and business owners need to track the right accounting and financial Key Performance Indicators (KPIs) every month.
Financial KPIs turn accounting data into actionable information.
Instead of asking:
“How is my business doing?”
you can ask:
“Is revenue growing at the expected rate?”
“Are our margins improving?”
“How much cash do we have?”
“How quickly are customers paying?”
“How many months of runway do we have?”
“Which products or customers are actually profitable?”
This article explains 15 important accounting KPIs every CEO should consider tracking monthly and how these numbers can help improve business decisions.
What Are Accounting KPIs?
Accounting KPIs are measurable financial indicators used to evaluate the financial performance and health of a business.
They help CEOs understand:
- Revenue performance
- Profitability
- Cash flow
- Expenses
- Working capital
- Debt
- Customer economics
- Business efficiency
A good KPI should help you answer an important business question.
For example:
Revenue Growth Rate → Is the business growing?
Gross Profit Margin → Are we making enough money from what we sell?
Net Profit Margin → Is the business ultimately profitable?
Cash Flow → Do we have enough cash to operate?
Receivable Days → Are customers paying us quickly enough?
Why CEOs Should Track Financial KPIs Monthly
Annual financial statements are important, but they are often too slow for day-to-day decision-making.
Monthly KPI tracking helps identify problems early.
For example:
January
Revenue: ₹50 lakh
Gross Margin: 45%
February
Revenue: ₹55 lakh
Gross Margin: 40%
March
Revenue: ₹60 lakh
Gross Margin: 34%
Revenue appears to be growing.
But the margin is collapsing.
Without KPI monitoring, management may celebrate increasing sales while missing a serious profitability problem.
The 15 Accounting KPIs Every CEO Should Track
Let’s look at the most important KPIs.
1. Revenue Growth Rate
Revenue growth shows how quickly your business is increasing its sales.
Formula
Revenue Growth Rate =
(Current Period Revenue − Previous Period Revenue) ÷ Previous Period Revenue × 100
Example
Previous month revenue:
₹40 lakh
Current month revenue:
₹50 lakh
Revenue growth:
25%
Why CEOs Should Track It
Revenue growth helps answer:
- Are sales increasing?
- Is our growth strategy working?
- Which products are driving growth?
- Are we growing faster or slower than before?
However, remember:
Revenue growth alone doesn’t mean the business is becoming healthier.
Growth without margins and cash flow can create financial pressure.
2. Gross Profit Margin
Gross profit margin tells you how much money remains after accounting for the direct cost of delivering your products or services.
Formula
Gross Profit Margin =
Gross Profit ÷ Revenue × 100
Example
Revenue = ₹1 crore
Cost of goods/services = ₹60 lakh
Gross profit = ₹40 lakh
Gross margin = 40%
Why It Matters
A declining gross margin can indicate:
- Increasing supplier costs
- Excessive discounting
- Pricing problems
- Higher production costs
- Poor product mix
CEOs should monitor this KPI every month.
3. Net Profit Margin
Net profit margin shows how much of your revenue remains after accounting for relevant business expenses.
Formula
Net Profit Margin =
Net Profit ÷ Revenue × 100
Example
Revenue = ₹1 crore
Net profit = ₹10 lakh
Net profit margin = 10%
Why It Matters
It tells you whether your business model is actually producing bottom-line profit.
A company can have strong revenue and gross margins but still generate little net profit because of:
- Salaries
- Rent
- Marketing
- Interest
- Technology costs
- Administrative expenses
- Other operating expenses
4. EBITDA Margin
EBITDA stands for:
Earnings Before Interest, Taxes, Depreciation and Amortization.
EBITDA margin can help management evaluate operating performance before certain financing, tax and non-cash accounting effects.
Formula
EBITDA Margin =
EBITDA ÷ Revenue × 100
Why CEOs Track It
It can be useful for comparing operational performance over time and, in appropriate contexts, with businesses having different financing structures.
It is particularly relevant for:
- Growing companies
- Larger SMEs
- Investors
- Companies preparing for fundraising
- Businesses considering acquisition or expansion
5. Operating Cash Flow
Profit isn’t the same as cash.
Operating cash flow measures cash generated or consumed through the company’s core operating activities.
Why It Matters
A company can report a profit while experiencing negative operating cash flow.
For example:
You make ₹50 lakh of sales.
But customers haven’t paid you yet.
Your P&L may show revenue and profit.
Your bank account doesn’t necessarily have the corresponding cash.
That’s why CEOs should monitor operating cash flow separately.
6. Cash Conversion Cycle
The Cash Conversion Cycle (CCC) measures how long it takes a business to convert money spent on operations and inventory back into cash from customers.
It is particularly important for businesses that hold inventory.
Basic Formula
CCC = Inventory Days + Receivable Days − Payable Days
A shorter cash conversion cycle generally means cash is recovered more quickly.
Example
Inventory Days = 40
Receivable Days = 30
Payable Days = 25
CCC:
40 + 30 − 25 = 45 days
That means approximately 45 days of operating cash is tied up in the conversion cycle.
7. Accounts Receivable Days
Also known as Days Sales Outstanding (DSO), this KPI measures how quickly customers pay.
Simple Formula
Receivable Days ≈
Average Accounts Receivable ÷ Credit Sales × Number of Days
Example
If customers are taking an average of 60 days to pay, but your payment terms are 30 days, there may be a collection problem.
Why CEOs Should Track It
Increasing receivable days can create:
- Cash shortages
- Working capital pressure
- Increased borrowing
- Collection costs
Growing sales don’t help much if the cash isn’t being collected.
8. Accounts Payable Days
Accounts payable days indicate how long the business takes to pay suppliers.
Why It Matters
If you pay suppliers too quickly while customers pay slowly, your cash flow can suffer.
For example:
Customer payment period = 60 days
Supplier payment period = 15 days
You may need to finance the 45-day gap.
However, extending payments beyond agreed terms can damage supplier relationships or create contractual issues.
The goal is efficient working capital management, not simply delaying payments.
9. Working Capital
Working capital indicates the short-term financial resources available to support business operations.
Basic Formula
Working Capital = Current Assets − Current Liabilities
Current assets may include:
- Cash
- Receivables
- Inventory
- Other short-term assets
Current liabilities may include:
- Supplier payables
- Short-term debt
- Other obligations
Why CEOs Should Track It
Rapid growth can consume working capital.
For example:
Sales increase → inventory increases → receivables increase → cash gets tied up.
This is why fast-growing businesses sometimes need additional funding even when sales and profits are increasing.
10. Operating Expense Ratio
This KPI measures operating expenses relative to revenue.
Formula
Operating Expense Ratio =
Operating Expenses ÷ Revenue × 100
Example
Revenue = ₹1 crore
Operating expenses = ₹30 lakh
Operating expense ratio = 30%
Track the ratio over time.
If revenue increases by 10% but operating expenses increase by 25%, management should investigate.
11. Burn Rate
Burn rate is especially important for startups and businesses that are currently spending more cash than they generate.
Example
Suppose your business has:
Monthly cash outflow = ₹15 lakh
Monthly cash inflow = ₹10 lakh
Net burn = ₹5 lakh per month
Why It Matters
Burn rate helps CEOs understand how quickly cash reserves are being consumed.
This is critical when:
- Raising funding
- Launching a new product
- Expanding operations
- Hiring aggressively
- Entering a new market
12. Cash Runway
Cash runway tells you how long your business can continue operating at the current rate of cash burn.
Basic Formula
Cash Runway = Available Cash ÷ Monthly Net Burn
Example
Cash available = ₹60 lakh
Monthly net burn = ₹5 lakh
Runway = 12 months
This gives management an early warning about when additional funding, cost reduction or revenue improvement may be necessary.
13. Customer Acquisition Cost (CAC)
CAC measures how much it costs to acquire a new customer.
Formula
CAC =
Sales & Marketing Costs ÷ Number of New Customers Acquired
Example
Monthly sales and marketing expense:
₹10 lakh
New customers:
100
CAC = ₹10,000
Why It Matters
Increasing customer acquisition costs can reduce profitability even if revenue continues to grow.
CEOs should track CAC alongside customer lifetime value.
14. Customer Lifetime Value (LTV)
Customer Lifetime Value estimates the economic value a customer generates over the relationship with the business.
The exact calculation depends on the business model.
A simplified subscription example could consider:
Average Revenue per Customer × Gross Margin × Expected Customer Lifetime
Example
Average annual revenue per customer = ₹50,000
Gross margin = 60%
Expected relationship = 3 years
Indicative LTV:
₹50,000 × 60% × 3
= ₹90,000
If CAC is ₹10,000, the economics may be attractive.
But if CAC rises to ₹80,000, the business needs to investigate whether acquisition remains sustainable.
15. Budget vs Actual Variance
One of the most useful management KPIs is the difference between what you planned and what actually happened.
For example:
| Category | Budget | Actual | Variance |
|---|---|---|---|
| Revenue | ₹50L | ₹46L | -₹4L |
| Marketing | ₹5L | ₹7L | +₹2L |
| Salaries | ₹10L | ₹10.5L | +₹0.5L |
| Rent | ₹2L | ₹2L | ₹0 |
| Operating Profit | ₹15L | ₹9L | -₹6L |
This immediately tells management where performance differs from expectations.
Bonus KPI: Return on Marketing Investment
For businesses that spend significantly on advertising and marketing, measuring return from marketing investment can be valuable.
A simple measure can compare attributable revenue or contribution against marketing spend.
For example:
Marketing spend = ₹5 lakh
Attributable revenue = ₹20 lakh
Revenue-to-marketing-spend ratio = 4x
However, CEOs should avoid treating revenue alone as ROI. Gross margin, fulfilment costs and attribution quality also matter.
How to Build a Monthly CEO Financial Dashboard
You don’t need 100 KPIs.
A good CEO dashboard can contain around 10–15 critical numbers.
For example:
| KPI | Current Month | Previous Month | Target |
|---|---|---|---|
| Revenue | ₹50L | ₹45L | ₹55L |
| Revenue Growth | 11% | 8% | 10% |
| Gross Margin | 42% | 44% | 45% |
| Net Margin | 12% | 13% | 15% |
| Operating Cash Flow | ₹7L | ₹5L | ₹10L |
| Receivable Days | 48 | 42 | <40 |
| Payable Days | 35 | 32 | 35 |
| Working Capital | ₹25L | ₹22L | ₹30L |
| Monthly Burn | ₹3L | ₹4L | <₹3L |
| Cash Runway | 10 months | 8 months | 12+ |
| CAC | ₹8K | ₹7.5K | ₹7K |
| LTV | ₹60K | ₹58K | ₹65K |
The exact KPIs and targets should be customized to the business model and industry.
How Often Should CEOs Review KPIs?
Not every KPI needs to be reviewed at the same frequency.
Daily
For businesses with high transaction volume:
- Sales
- Cash position
- Orders
- Collections
Weekly
Consider:
- Cash flow
- Receivables
- Sales performance
- Marketing spend
- Major expenses
Monthly
Review the complete financial dashboard:
- Revenue
- Gross margin
- Net profit
- Cash flow
- Working capital
- Receivables
- Payables
- Budget variance
Quarterly
Perform a deeper strategic review:
- Business profitability
- Product profitability
- Customer profitability
- Pricing
- Cost structure
- Forecasts
- Capital requirements
How CEOs Can Use KPIs to Make Better Decisions
Financial KPIs are useful only when they lead to action.
Consider this situation:
Revenue
↑ 20%
Gross Margin
↓ 8%
Receivable Days
↑ 20 days
Operating Expenses
↑ 25%
The company appears to be growing.
But four warning signs exist.
Management may need to:
- Review pricing
- Reduce unnecessary expenses
- Improve collections
- Analyze product margins
- Reassess growth strategy
This is the real value of financial KPIs.
Don’t Track KPIs in Isolation
One KPI rarely tells the complete story.
For example:
Revenue ↑
Sounds positive.
But:
Gross Margin ↓
Potential concern.
And:
Cash Flow ↓
Bigger concern.
And:
Receivable Days ↑
Potential explanation.
The combination of KPIs gives CEOs a much clearer picture.
Financial KPIs for Different Types of Businesses
Not every business needs the same dashboard.
Service Businesses
Focus on:
- Revenue
- Gross Margin
- Net Margin
- Utilization
- Receivable Days
- Customer profitability
- Operating expenses
E-commerce Businesses
Focus on:
- Revenue
- Gross Margin
- CAC
- Average Order Value
- Return Rate
- Inventory Turnover
- Contribution Margin
- Cash Conversion Cycle
SaaS Businesses
Focus on:
- MRR
- ARR
- Churn
- CAC
- LTV
- Gross Margin
- Burn Rate
- Cash Runway
Manufacturing Businesses
Focus on:
- Gross Margin
- Production Cost
- Inventory Turnover
- Working Capital
- Receivable Days
- Payable Days
- Capacity Utilization
- Cash Conversion Cycle
Professional Firms
Focus on:
- Revenue per employee
- Billable utilization
- Receivable Days
- Gross Margin
- Net Profit Margin
- Client profitability
- Operating expenses
Common Mistakes CEOs Make With Financial KPIs
Mistake 1: Tracking Too Many Numbers
More KPIs don’t necessarily mean better management.
Focus on the numbers that influence decisions.
Mistake 2: Looking Only at Revenue
Revenue is important.
But revenue without profit and cash flow can be misleading.
Mistake 3: Reviewing KPIs Only Once a Year
Annual review is too late for many problems.
Monthly monitoring is much more useful.
Mistake 4: Ignoring Cash Flow
Profit doesn’t automatically mean cash is available.
Mistake 5: Using Industry Benchmarks Blindly
A benchmark from one industry may be inappropriate for another.
Compare your KPIs with:
- Your historical performance
- Your budget
- Your business model
- Relevant industry benchmarks
Mistake 6: Not Assigning Responsibility
Every KPI should ideally have someone responsible for monitoring and improving it.
For example:
Receivable Days → Finance/Collections
CAC → Marketing
Gross Margin → Finance + Operations
Revenue → Sales
How a CA or Virtual CFO Can Help
Many business owners have accounting data but don’t have the time or expertise to convert it into useful management information.
A CA or Virtual CFO can help businesses:
- Build financial dashboards
- Establish KPI systems
- Analyze profitability
- Forecast cash flow
- Monitor working capital
- Identify financial risks
- Prepare budgets
- Review variance
- Improve financial controls
- Support strategic decisions
This becomes increasingly valuable as the business grows.
A Practical Monthly CEO KPI Review
At the end of every month, ask these questions:
Revenue
Did we achieve our sales target?
Profitability
Are margins improving or declining?
Expenses
Which expenses exceeded budget?
Cash
How much cash do we have?
Collections
How much money are customers yet to pay?
Working Capital
How much cash is tied up in operations?
Debt
Is our debt increasing or decreasing?
Customers
Are customers becoming more or less profitable?
Growth
Is growth sustainable?
Forecast
What will our financial position look like 3–6 months from now?
These questions can turn a monthly accounting review into a powerful management meeting.
Final Thoughts
Accounting isn’t just about recording transactions and filing returns.
For a CEO, financial information should be a decision-making system.
Tracking the right KPIs every month helps you understand whether your business is:
- Growing
- Profitable
- Cash-generating
- Efficient
- Financially stable
- Ready to scale
Start with a small set of meaningful KPIs rather than trying to track everything.
At a minimum, most CEOs should understand their revenue growth, gross margin, net profit margin, operating cash flow, receivables, payables, working capital, operating expenses and cash position.
As the business becomes more sophisticated, add metrics such as CAC, LTV, burn rate, runway and cash conversion cycle where relevant.
The goal isn’t to create a complicated spreadsheet.
The goal is to know what is happening in your business before the numbers become a problem.
Frequently Asked Questions
1. What are the most important accounting KPIs for a CEO?
Key KPIs include revenue growth, gross profit margin, net profit margin, operating cash flow, accounts receivable days, working capital, operating expenses and cash position. Startups may also track CAC, LTV, burn rate and runway.
2. How often should financial KPIs be reviewed?
Most businesses should review their core financial KPIs monthly. Cash and sales may need weekly or daily monitoring depending on the business.
3. Is revenue the most important KPI?
No. Revenue shows sales performance, but it doesn’t tell you whether those sales are profitable or generating cash. Revenue should be evaluated alongside margins and cash flow.
4. What KPIs should startups track?
Startups commonly track revenue growth, MRR/ARR where applicable, gross margin, burn rate, cash runway, CAC, LTV, churn and operating cash flow.
5. How can a Virtual CFO help with KPI tracking?
A Virtual CFO can design financial dashboards, establish reporting systems, analyze trends, prepare forecasts and help management turn financial data into strategic decisions.
6. Can a small business use the same KPIs as a large company?
Not necessarily. KPIs should reflect the company’s size, business model, industry, stage of growth and strategic objectives.
Need Help Understanding Your Business Numbers?
Financial reports can tell you what happened. The right financial KPIs can help you understand why it happened and what to do next.
Expenect connects businesses with Chartered Accountants, accountants and Virtual CFOs who can help establish financial reporting systems, analyze business performance, improve financial visibility and support better decision-making.
Don’t just track your accounts. Track the numbers that drive your business.